Trial and Error in Strategy Development
I initially started with the classic Moving Average (MA) strategy. To be honest, I don’t remember the exact steps I followed, but after that, I tried oscillator-based indicators and every strategy I could think of.
Instead of manually checking historical charts, I utilized TradingView’s backtesting feature to streamline the process.
Conditions Prioritized in the Initial Stage
At first, I searched for strategies that seemed practical based on the following criteria:
-
Frequent Trading Opportunities: At least once per day
-
Risk-Reward Ratio of 1:1: Balanced profit and stop-loss targets
-
Win Rate Above 50%: Ensuring a statistical edge
-
Controlled Impact of Spreads: Stop-loss of 30 pips and take-profit of 30 pips
A Stable Combination
After testing various strategies, I found that a combination of ultra-short-term RSI and MA performed relatively consistently, so I adopted it as my base strategy.
When applying the strategy via Pine Script on the USDJPY 5-minute chart, the win rate was 51.54%. However, when switching to longer timeframes, such as the 15-minute chart or higher, the win rate started to decline. On the 1-hour chart, the win rate dropped to 47.52%, showing a downward trend.
This suggests that counter-trend strategies might be more effective on the 1-hour timeframe.
//@version=6
strategy("RSI Strategy (USDJPY 5min) Draft", overlay=true, default_qty_type=strategy.percent_of_equity, pyramiding=1, initial_capital=5000000, currency="JPY", default_qty_value=100, commission_type=strategy.commission.percent, commission_value=0.0, margin_long=1/100, margin_short=1/100)

// 期間を2に変更、RSI overSold、overBoughtを5と95に
length = input(2)
overSold = input(5)
overBought = input(95)
longLength = input.int(200, "Long MA Length")
price = close
vrsi = ta.rsi(price, length)
longma = ta.sma(close, longLength)

// overSoldかoverBought
co = ta.crossover(vrsi, overSold) and strategy.position_size == 0 and close > longma
cu = ta.crossunder(vrsi, overBought) and strategy.position_size == 0 and close < longma

// maをチャートに表示
plot(longma, title="Long MA", color=color.new(color.gray, 0), linewidth=2, style=plot.style_line)

// 損切と利確の設定
stop_loss_pips = input.float(29, "Stop Loss (in pips)")
take_profit_pips = input.float(31, "Take Profit (in pips)")

// 利確損切Pips計算
pips_multiplier = syminfo.mintick * 10
adjusted_stop_loss = stop_loss_pips * pips_multiplier
adjusted_take_profit = take_profit_pips * pips_multiplier

if (not na(vrsi))
    if (co)
        strategy.entry("RsiLE", strategy.long, comment="RsiLE")
    strategy.exit("RsiLE Exit", stop=strategy.position_avg_price - adjusted_stop_loss, limit=strategy.position_avg_price + adjusted_take_profit)
    if (cu)
        strategy.entry("RsiSE", strategy.short, comment="RsiSE")
    strategy.exit("RsiSE Exit", stop=strategy.position_avg_price + adjusted_stop_loss, limit=strategy.position_avg_price - adjusted_take_profit)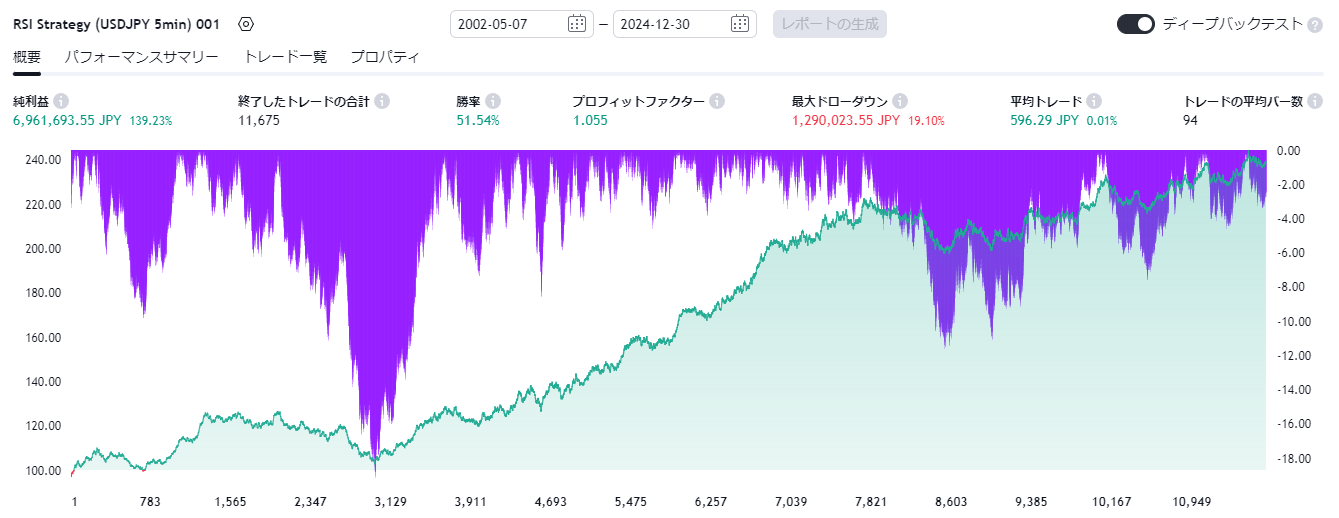
Understanding the Strategy and Future Challenges
Based on the results so far, I’m considering the following next steps:
- Why does the win rate decrease on higher timeframes?
- What specific market conditions is this strategy targeting?
By thoroughly understanding these points, I aim to refine the strategy through better filtering criteria and further improvements.